4.5. The web interface - an overview
From open-support.info
(Created page with "{{Book |next=../6 |heading=4.5. |title=The web interface - an overview |status=effective |progress=00 |author=Dick6809 }} <onlyinclude>On successfully logging into the system, yo...") |
(Created page with "{{Book |next=../6 |heading=4.5. |title=The web interface - an overview |status=effective |progress=00 |author=Dick6809 }} <onlyinclude>On successfully logging into the system, yo...") |
||
| Line 10: | Line 10: | ||
| - | + | {{book/figure|image=OTRS_3_0_-_Admin_Manual_First-screen.png|id=Figure 4.5|title=Dashboard of the agent interface.}} | |
| Line 28: | Line 28: | ||
| - | + | {{book/figure|image=OTRS_3_0_-_Admin_Manual_Edit-settings.png|id=Figure 4.6|title=Dashboard Settings.}} | |
| Line 36: | Line 36: | ||
| - | + | {{book/figure|image=OTRS_3_0_-_Admin_Manual_Footer.png|id=Figure 4.7|title=Footer.}}</onlyinclude> | |
Revision as of 05:09, 24 April 2011
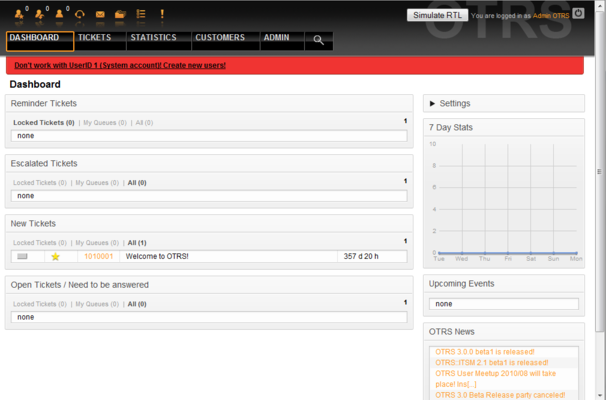
On successfully logging into the system, you are presented with the Dashboard page (see Figure 4.5 below). The Dashboard is completely customizable. It shows your locked tickets, allows direct access through menus to the queue, status and escalation views, and also holds options for creation of new phone and e-mail tickets. It also presents a quick summary of the tickets which are pending, escalated, new and open.
To improve clarity, the general web interface is separated into different areas. The top row of each page shows some general information such the current username, the logout button, icons listing the number of locked tickets with direct access to them, links to create a new phone/e-mail ticket, etc. There are also icons to go to the queue, status and escalation views.
Below the icons row is the navigation bar. It shows a menu that enables you to navigate to different areas or modules of the system, lettng you execute some global actions. Clicking on the Dashboard button takes you to the dashboard which is the default start page after login. If you click on the Tickets button, you will get a submenu with options to change the ticket's view, create a new ticket (phone/e-mail) or search for a specific ticket. The Statistics button presents a menu that allows choosing from an overview of the registered statistics, creating a new one or importing an existing one. The Customers button leads you to the Customer Managment screen. By clicking the Admin button, you can access all the administrator modules, allowing you to create new agents, queues, etc. There is also a Search button to make ticket searches.
If any associated applications are also installed, e.g. the File Manager or the Web Mailer, buttons to reach these applications are also displayed.
The red bar below the navigation bar shows different system messages. If you are logged in as OTRS administrator, you get a message warning you not to work using this system account.
Below the title of the section you are currently in, there are several subsections each in a separate box. These boxes can be relocated within the same column by clicking on and dragging the box header, and dropping them elsewhere.
In the left column, you can see information on some tickets clasified as - reminder, escalated, new and open. In each of the categories, you are also able to see all tickets you are allowed to access, how many tickets you have locked and how many are located in "My Queues". "My Queues" are queues that you identify in your user configuration account preferences as those you have a special interest in tracking.
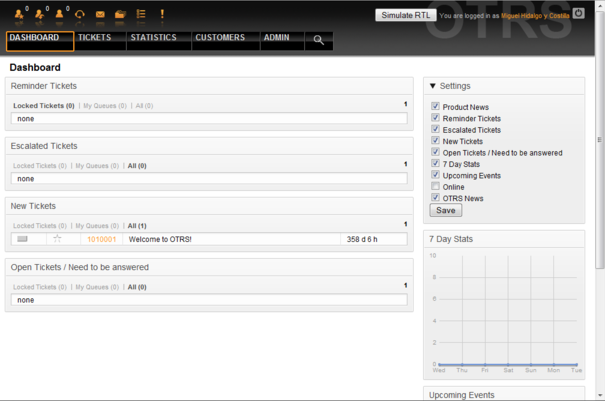
In the right column is the Settings button. Click on it to expand the section and see the various settings, as shown in Figure 4.6. You can then check or uncheck the individual settings options, and save your changes. This section is fixed, so you can not drag and drop it.
Below the settings area, you can see a section with a graph of ticket activity over the past 7 days. Further below is a section showing Upcoming Events and OTRS News.
Finally at the bottom of the page, the site footer is displayed (see Figure 4.7 below). It contains links to directly access the OTRS official website, or go to the Top of the page.

