19.1. Handling of the module by the agent
From open-support.info
When signed on as an agent, the navigation bar displays the link "Statistics". This has various submenu options, as shown in Figure 19.1.

The different options provided in the statistics menu are:
- Overview.
- Presents a list of different pre-configured reports.
- New.
- Requires rw rights.
- Import.
- Requires rw rights.
Contents |
Overview
Selecting the "Statistics" link in the navigation bar, and then the submenu link "Overview", calls up the Overview screen. The Overview screen presents a list of all pre-configured reports the agent can use (see Figure 19.2 below).

The following information is provided for each of the standard reports listed in the Overview:
- Stat#.
- Unique report number.
- Title.
- Title of the report.
- Object.
- Object used for generating the statistic. In the case of a static statistic, no object is displayed as no dynamic object is used for its generation.
- Description.
- A brief description of the report.
When the stats module is installed, it comes preloaded with a few sample reports imported into the system. These are shown as a list on the Overview page. If the Overview list extends to more than a single page, the agent can browse through the different pages. The list of reports can be sorted as desired, by clicking the desired column header in the list. To generate a particular report, click on the stat number associated with the report in the Overiew list. This brings up the "View" interface for the report.
Generate and view reports
The view user interface provides the stat's configuration settings (see Figure 19.3 below).

Configuration settings for a particular report can be set within the range of options in the View screen. Either the report creator or any others with the appropriate permissions can make the settings.
The page shows the following:
- Possible actions:
-
- Go to overview. Link back to the Overview list of reports.
- Edit. Edit the current report structure (rw rights required).
- Delete. Delete the current report (rw rights required).
- Export config. Export a report configuration, via file download (rw rights required).
- Usage: Export and Import functions allow for the convenient creation and testing of reports on test systems and subsequent easy integration into the production system.
- Report details:
-
- Stat#. Number of the report.
- Title. Title of the report.
- Object. Object used for generating the report.
- Description. Description on the report's purpose.
- Format. Report output format which, depending on the configuration, can be any of the following output formats:
- CSV.
- Print.
- Graph-lines.
- Graph-bars.
- Graph-hbars.
- Graph-points.
- Graph-lines-points.
- Graph-area.
- Graph-pie.
- Graphsize. Size in pixels for the graphic / chart. This option is only given when the report configuration allows a chart. All generally usable graphic sizes are configured by the OTRS administrator in SysConfig. The agent can then pre-select all relevant formats, while configuring the report.
- Sum rows. Indicates whether the report is amended by a column, whose cells state the sums of the respective rows.
- Sum columns. Indicates whether the report is amended by a row, whose cells state the sum of the respective columns.
- Cache. Indicates whether the generated report is cached in the filesystem.
- Valid. This can be set to "invalid" if a report must not be run temporarily for any reason. The "Start" button in the bottom of the right panel is then no longer displayed. The report can no longer be generated.
- Created. Creation time of the report.
- Created by. Name of the agent who created the report.
- Changed. Time when the report was last modified.
- Changed by. Name of the agent who altered the report last.
- X-axis. Using this function, the agent can switch the x and y axes (only when activated by the OTRS administrator).
- The general information is followed by information about the report itself. There are two different report (or stat) views:
- Static stat view. Static report generators can be integrated into the stats module (see Figure 19.4 below).
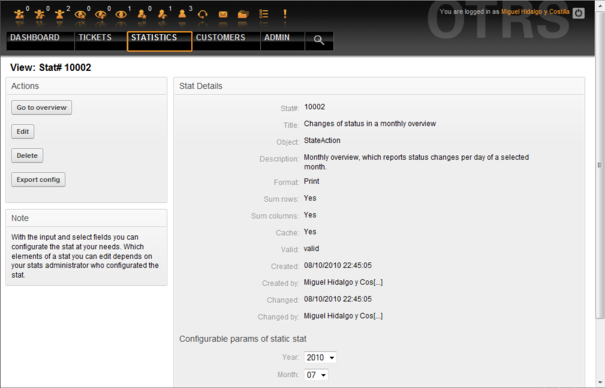 Figure 19.4. Viewing a static report.
- Dynamic stat view (see Figure 19.3 above). They can be displayed in two different ways:
- Unchangeable settings. The originator of the report has no permission for modifying this fields.
- Changeable settings. The configuration settings of such reports can be changed by the agent.
- Static stat view. Static report generators can be integrated into the stats module (see Figure 19.4 below).

Pressing the "Start" button (at the bottom of the screen) is the last step to generate the report. There are two possible reasons for this button to not be displayed:
- The report was set to invalid and thus, deactivated.
- The report was not configured cleanly and is, therefore, not yet executable. In this case, the necessary information can be found in the OTRS notification section (below the navigation bar).
If the settings on the View page are incorrect, this page is shown again after the "Start" button was pushed, and information about which input was incorrect is provided in the notification section.
Edit / New
Agents with write rights can edit an existing report configuration by calling up the edit user interface of the stats module. Alternately, they may create a new report. The associated screens can be reached in the following manner:
- Edit: Via the "Edit" button in the stat view.
- New: Via the "New" link in the Statistics menu from the navigation bar, or the "Add" button from the Overview page.
The stats are edited with a wizard in four steps:
- General specifications.
- Definition of the element for the X-axis.
- Specification of the value series.
- Selecting the restrictions to limit the report.
Steps 2 through 4 are only needed for the generation of reports with dynamic stats. For a static stat, only the general information (point 1) is required.
Information about how to handle the page is provided on each of these screens, below the Actions panel in a Hints panel.
If incorrect inputs are entered, the previously processed user interface is displayed again and with information about the incorrect input. This information can be found in the OTRS notification section. The next input user interface is only displayed after the current form has been filled out correctly.
-
General specifications. It is the first page of the Edit wizard (see Figure 19.5 below).
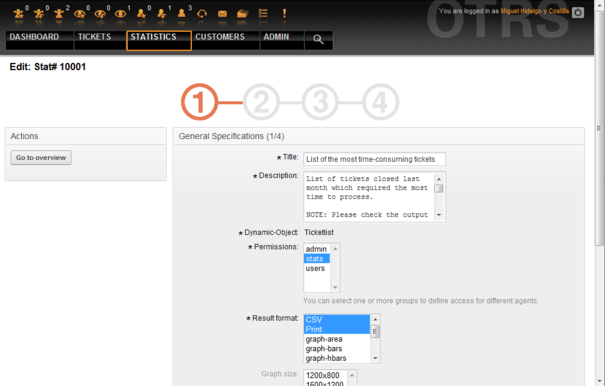 Figure 19.5. Editing the general specifications of a report.
In the screen showed in Figure 19.5, there are a great number of common specifications and settings that can be edited:- Title.
- Should reflect the stat's purpose in a concise manner.
- Description.
- More descriptive information about the report definition, type of configuration parameters, etc.
- Dynamic object.
- If the OTRS installation provides various dynamic objects, one of them can be chosen. The objects meet the requirements of the particular modules.
- Static file.
- Usually this selection is not shown, as only static files which are not yet assigned to any reports are displayed. If "Static file" is displayed, however, it is important to tick the option field and select a generation mode (dynamic with a dynamic object or static with a file). If a static file is selected, the input user interfaces 2 through 4 are not shown as the static file contains all required configuration settings.
- Permission settings.
- Facilitate a restriction of the groups (and therefore, agents) who can later view and generate the preconfigured reports. Thus the various reports can be allocated to the different departments and work groups who need them. It is possible to allocate one report to various groups.
- Example 1: The "stats" group was selected. The report is viewable for all users having at least ro rights for the "stats" group. This access is available by default.
- Example 2: A group named "sales" was selected. All users with ro rights for the "sales" group can see the stat in the view mode and generate it. However, the report will not be available for viewing by other users.
- Format.
- Output format of the stat: Depending on the configuration, one or more of the following formats can be chosen:
- CSV.
- Print.
- graph-lines.
- graph-bars.
- graph-hbars.
- graph-points.
- graph-lines-points.
- graph-area.
- graph-pie.
- Graphsize.
- Select the chart size in pixels. This selection is only necessary if a graphical output format has been chosen under "Format". All graphic sizes that can generally be used are defined by the OTRS administrator in SysConfig. When configuring the report, the agent can pre-select all relevant formats.
- Sum rows.
- Indicates whether the report is amended by a column, whose cells contain the sum of the respective row.
- Sum columns.
- Indicates whether the report is amended by a row, whose cells contain the sum of the respective column.
- Cache.
- Specifies if the generated report should be cached in the filesystem. This saves computing power and time if the report is called up again, but it should only be used if the report's content is no longer changing.
- Caching is automatically prevented if the report contains no time designation values, or if a time designation value points to the future.
- If a cached report is edited, all cached data is deleted.
- Valid.
- This can be set to "invalid" if a pre-configured report must not be run temporarily for any reason. The "Start" button in the bottom of the right panel is then no longer displayed. The report can no longer be generated.
-
Definition of the element for the X-axis. It is the configuration of the element used for the depiction of the X-axis or, if tables are used, of the column name applied to the X-axis (see Figure 19.6).
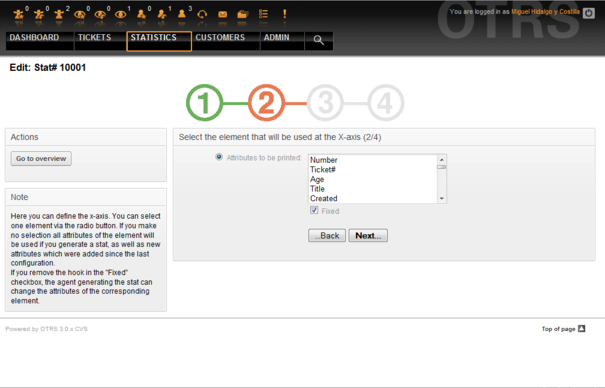 Figure 19.6. Definition of the element for the X-axis.
First of all, an element is selected using the option field. Then two or more attributes of the element must be selected. If no attributes are selected, all attributes are used including those added after the configuration of the report.If the "Fixed" setting is disabled, the agent generating the report can change the attributes of the respective element in the "View" user interface.
Time elements are different as time period and scale have to be stated. Type and number of elements result from the used dynamic object and vary depending on it.
If all input is correct, the "Next" button leads to the "Value series" form. It is also possible to go back to editing earlier sections.
-
Specification of the value series.
In the third step of the report configuration, the value series are defined (see Figure 19.7 below). They will later form the individual graphs or the various series within a tabular view.
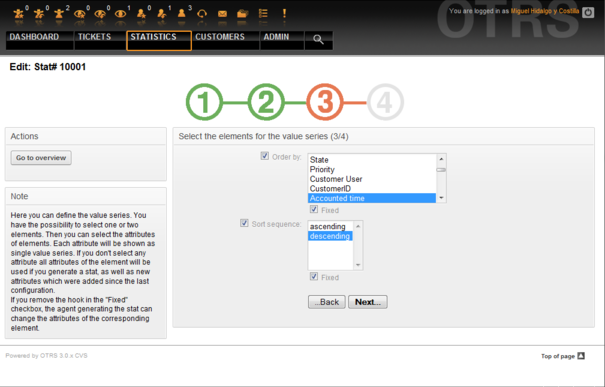 Figure 19.7. Definition of the value series.
If an element is selected, each chosen attribute will correspond to a value series (see the Example 19-1 below).Example 19.1. Definition of a value series - one element Element Queue: - Value series 1 = Raw - Value series 2 = Junk ....
If two elements are selected, each selected attribute of the first element is combined with an attribute of the second element to form a value series (see Example 19-2 below).Example 19.2. Definition of a value series - two elements Element 1 queue, Element 2 status: - Value chain 1 = Raw - open - Value series 2 = Raw - successfully closed - Value series 3 = Junk - open - Value series 4 = Junk - successfully closed
Selection of three or more elements is not allowed.Additionally the same conditions apply to the selection of the attributes and the "Fixed" checkbox as to the "X-axis" selection:
- If no attributes of the element are selected, all attributes are used, including those added after the configuration of the report.
- If the "Fixed" setting is disabled, the agent generating the report can change the attributes of the respective element.
-
Setting restrictions to the report. This is the fourth and final step of the configuration (see Figure 19.8 below). The restrictions serve to limit the results to the selected criteria. In many cases, no restrictions at all may be set up.
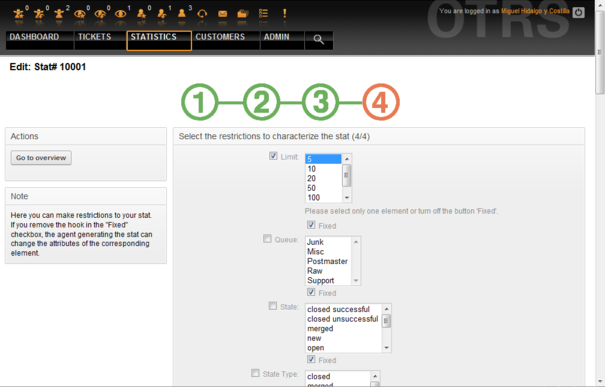 Figure 19.8. Definition of restrictions.
After all the restrictions are set up, the configuration of the report is completed by pressing the "Finish" button.


Import
The Import user interface (see Figure 19.9 below) can be accessed by choosing from the navigation bar, the link "Statistics", then "Import". Alternately, pressing the Import button on the Overview screen achieves the same result. "rw" rights to the report are required.

Facilitates the import of reports and is, when combined with the export function of the module, a very handy functionality. Stats can be created and tested conveniently on test systems, then imported into the production system.
The import is effected by an easy file upload. The "View" user interface of the imported report is opened automatically afterwards.